Case Study 2
OptyFlow
A real-time public transportation management system built for US city operators.
Challenge:
Insufficient operational efficiency.
Assumption:
Providing role-based traffic insights and KPI dashboards would help operators and engineers identify issues faster and make more informed decisions.
Scope of Work:
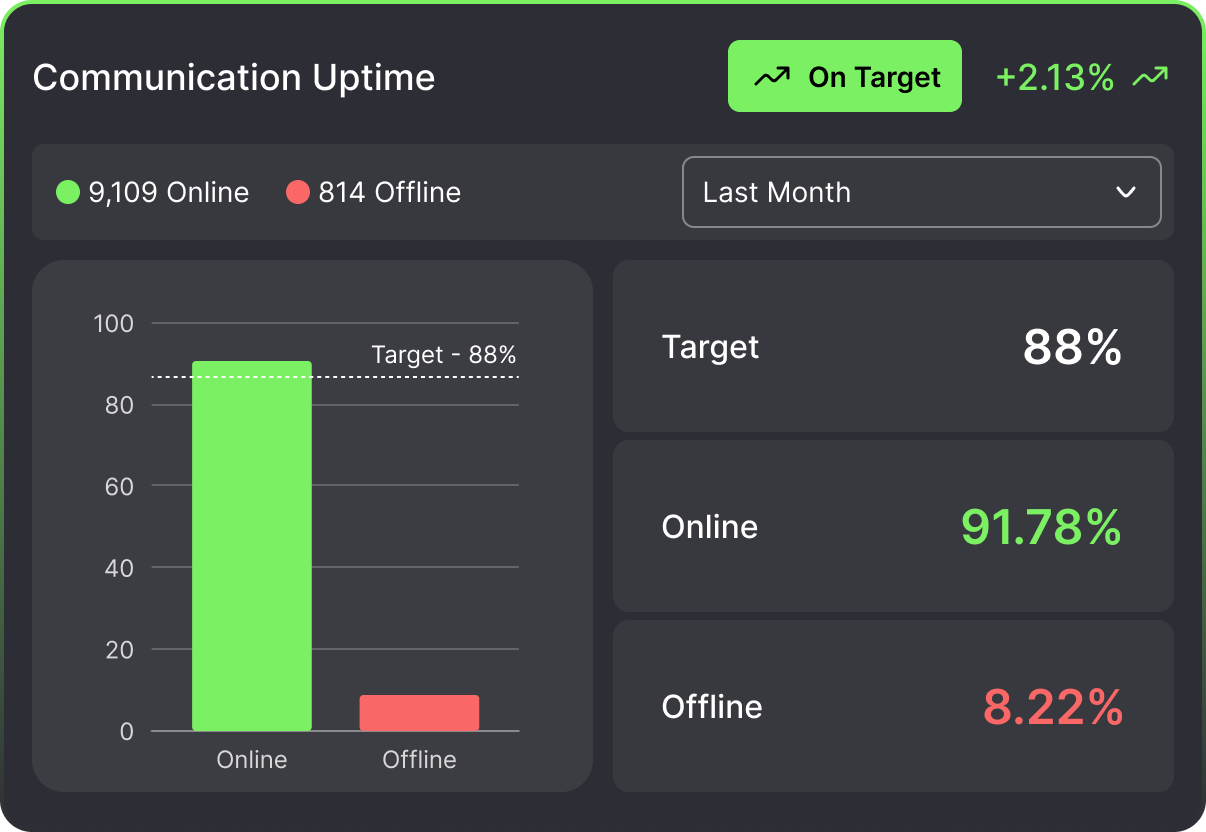
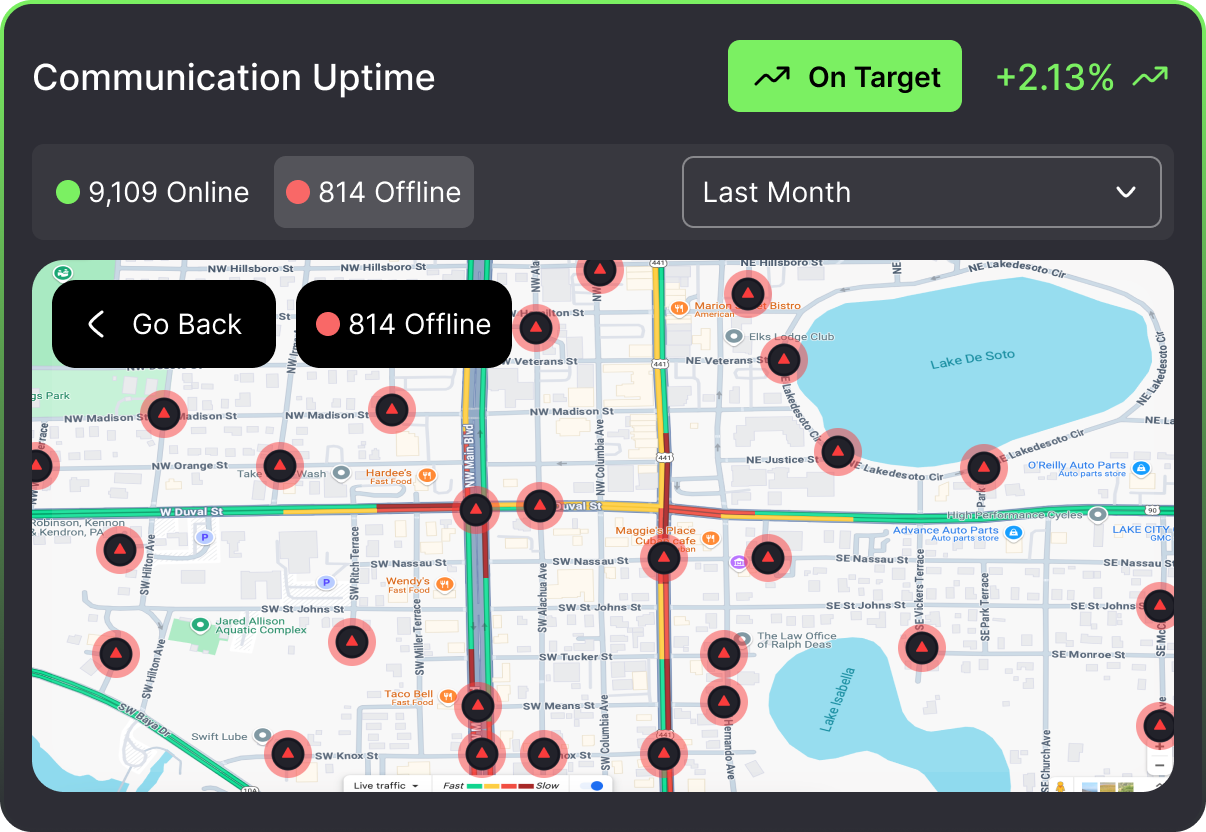
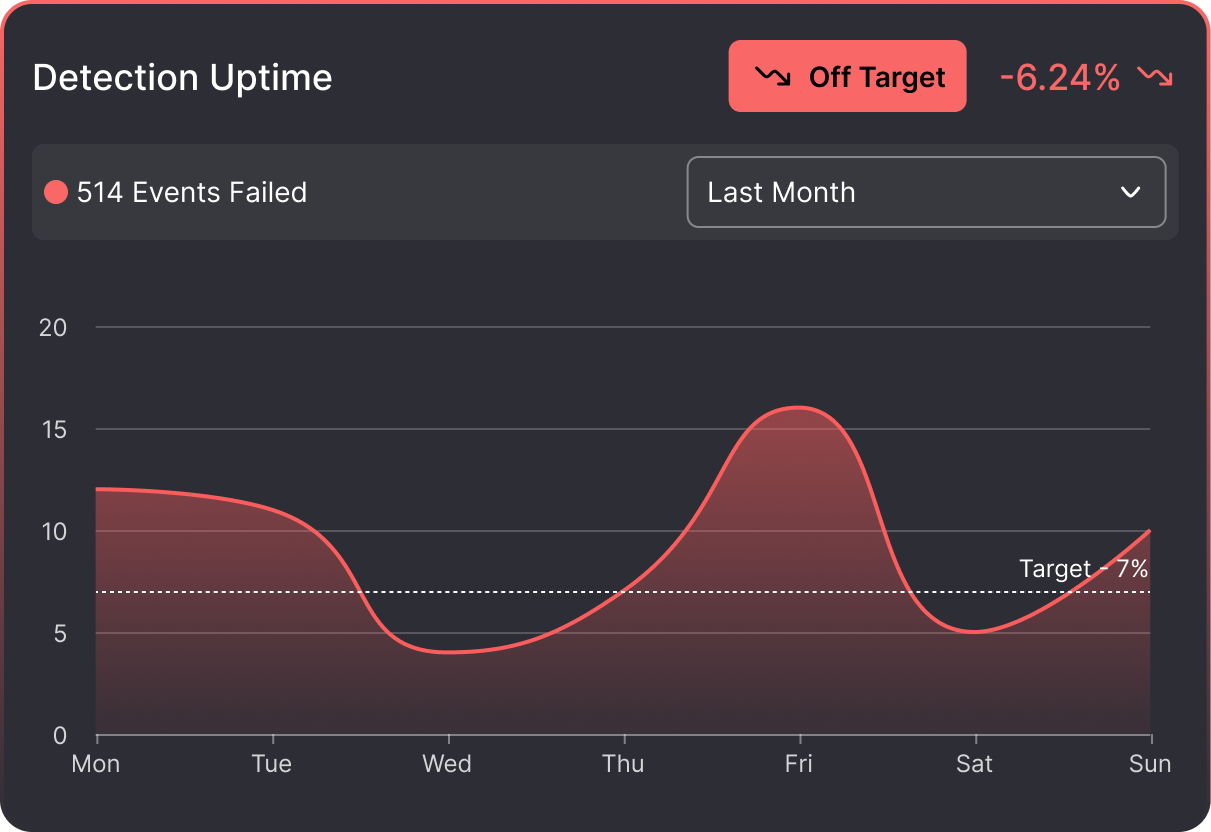
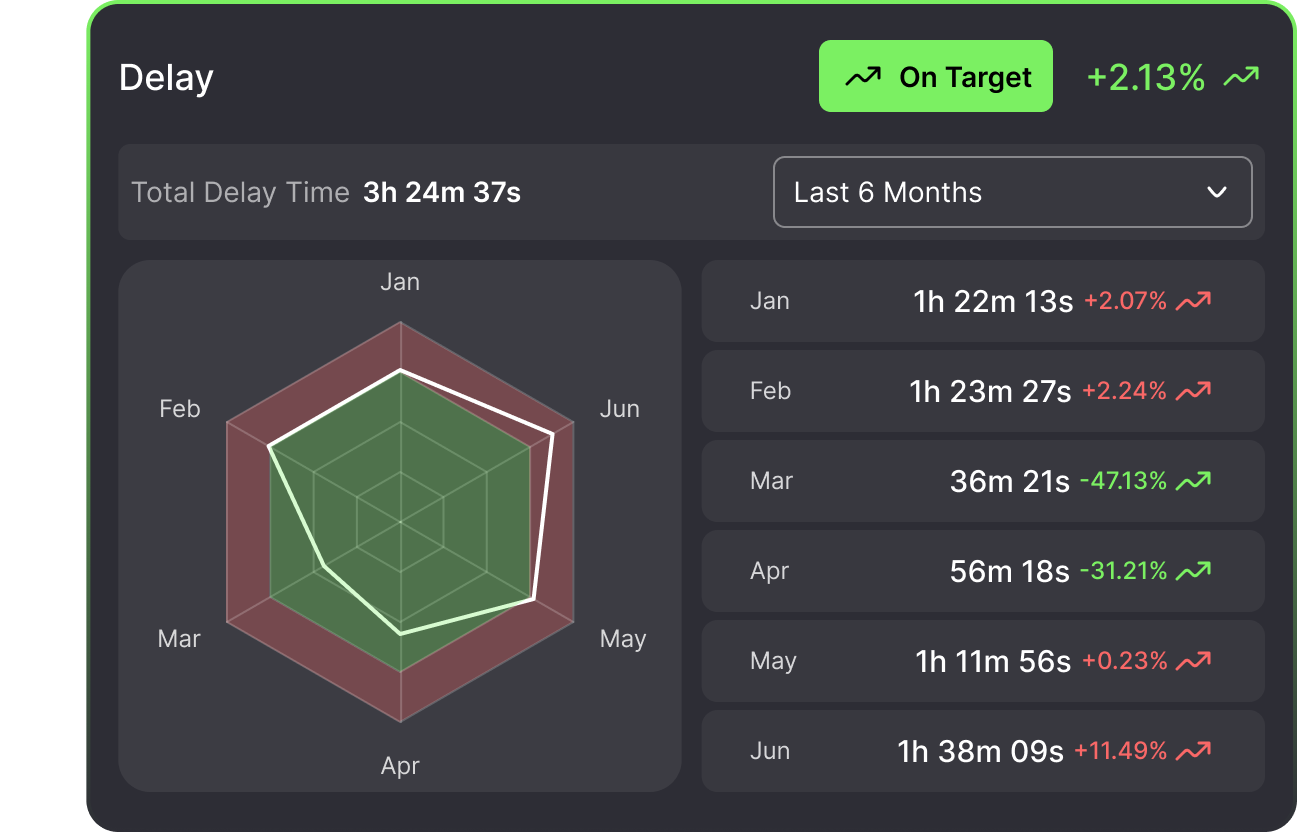
Design of a role-based traffic management dashboard, including KPI definition, information architecture, and real-time data visualization for city operators and traffic engineers.
Goal:
Improve operational efficiency by reducing the time required to analyze traffic conditions and make decisions.
Key Responsibilities:
UX Research
User Interviews
Information Architecture
Ideation
Wireframing
Validating Ideas
Prototyping
Iterating
High-Fidelity Mockup
Microinteractions
Developer Handoff

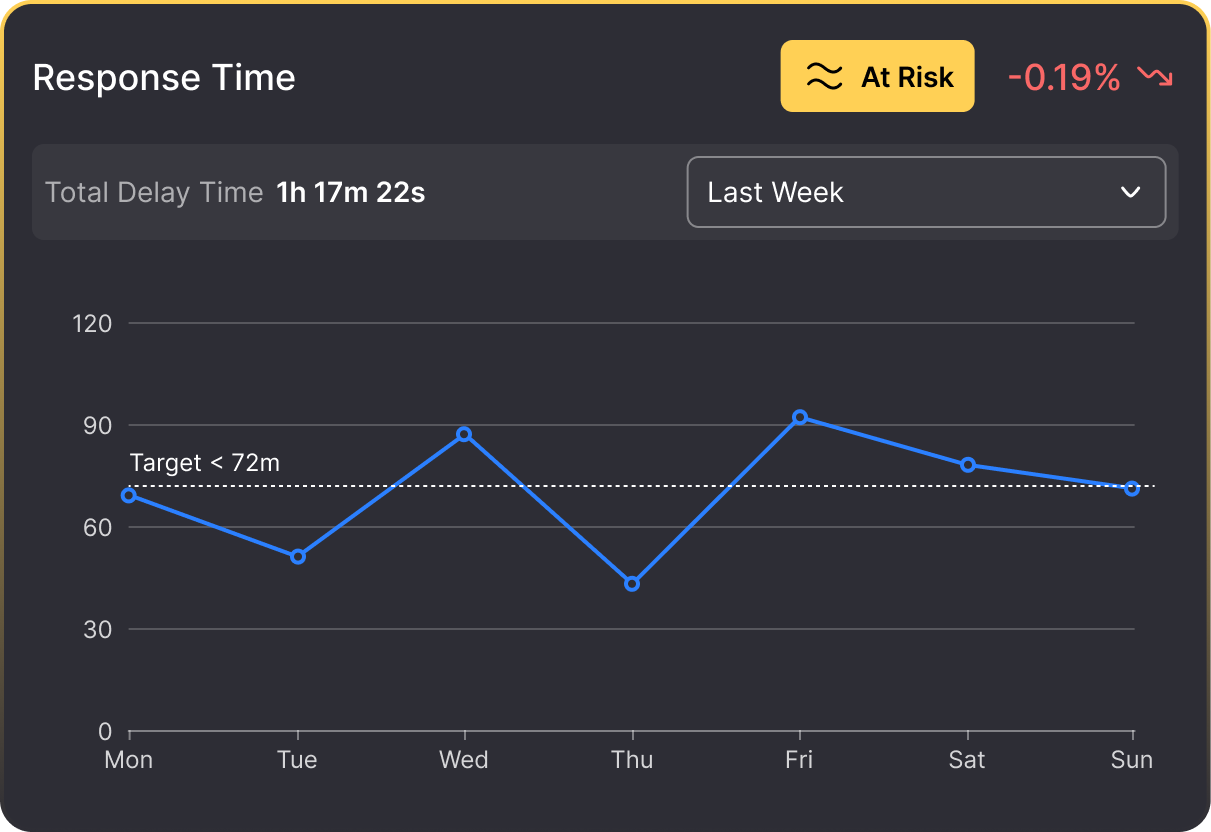
Dashboard Widgets & States
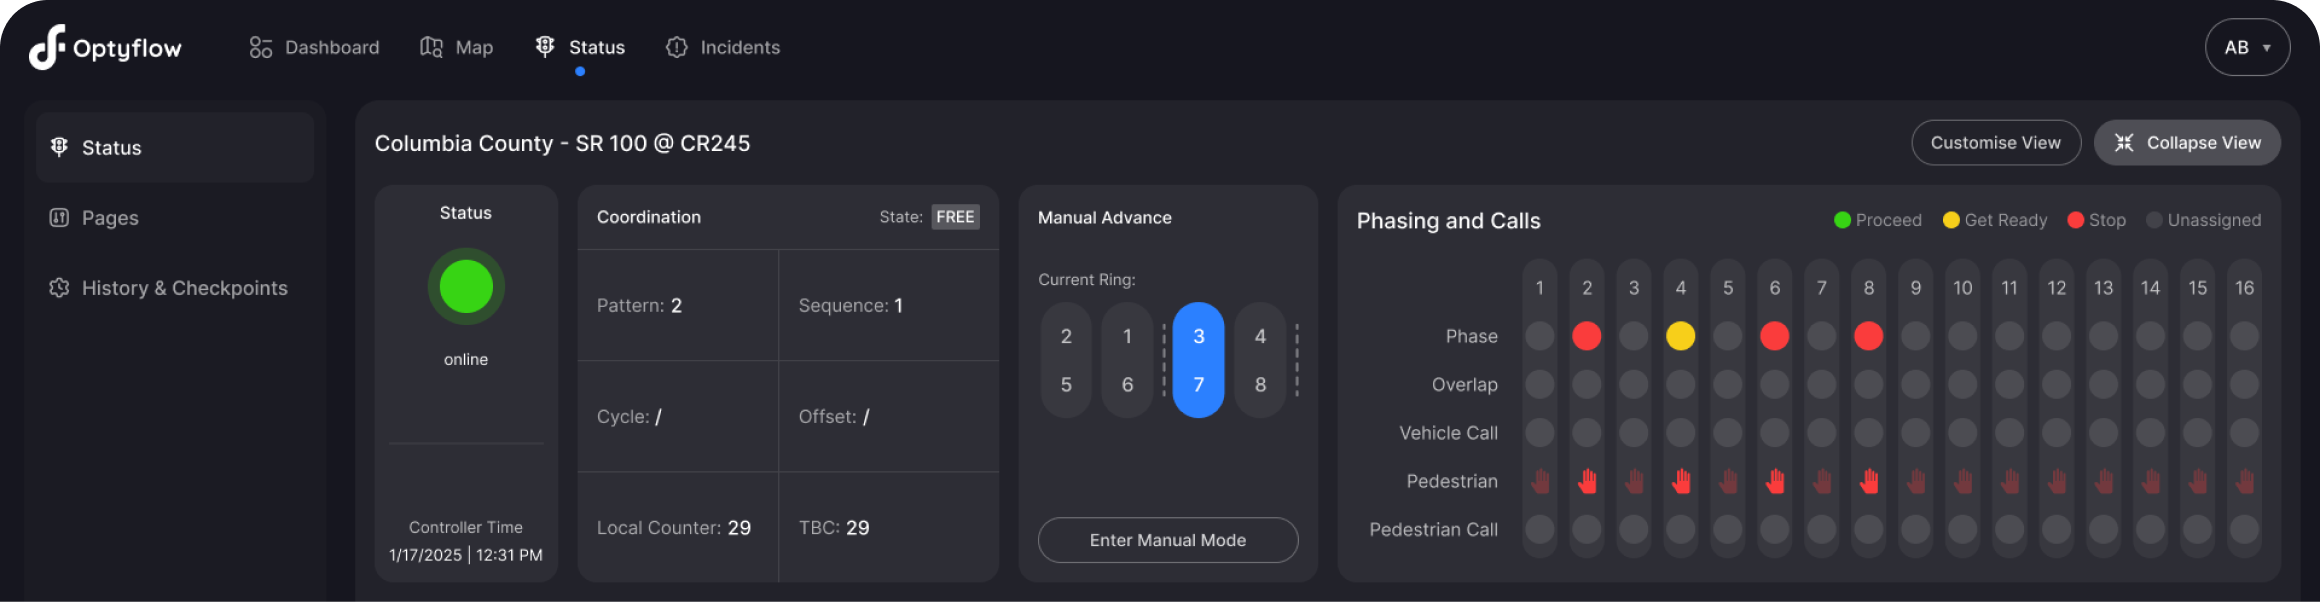

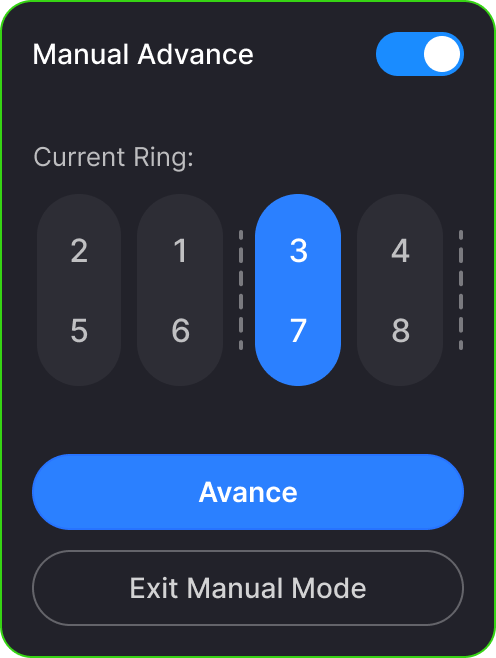
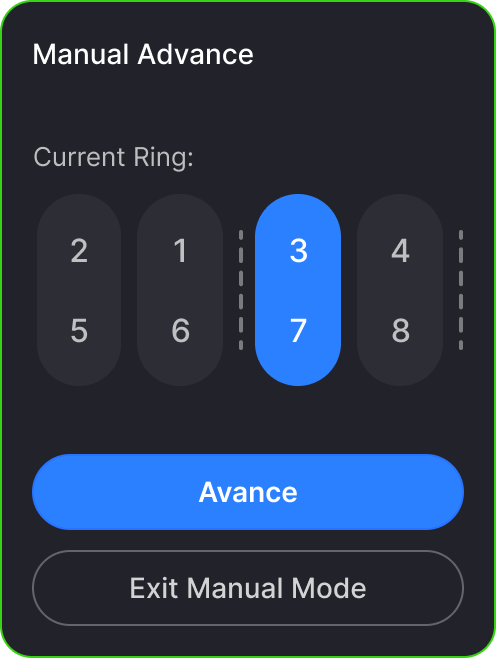
Manual Advance Widget
Initial state if the ‘Manual Advance’ is disabled in the main settings. Can be enabled via the link.

Widget when ‘Manual Advance’ is enabled in the main settings. ‘Enter Manual Mode’ turns it on. The flow prevents accidental errors.

When the widget is ‘ON’ it allows operators ‘advance’ to another ring or exit manual mode by clicking on respective buttons.
Exploring & Validating Options
Interactive Prototype - Testing
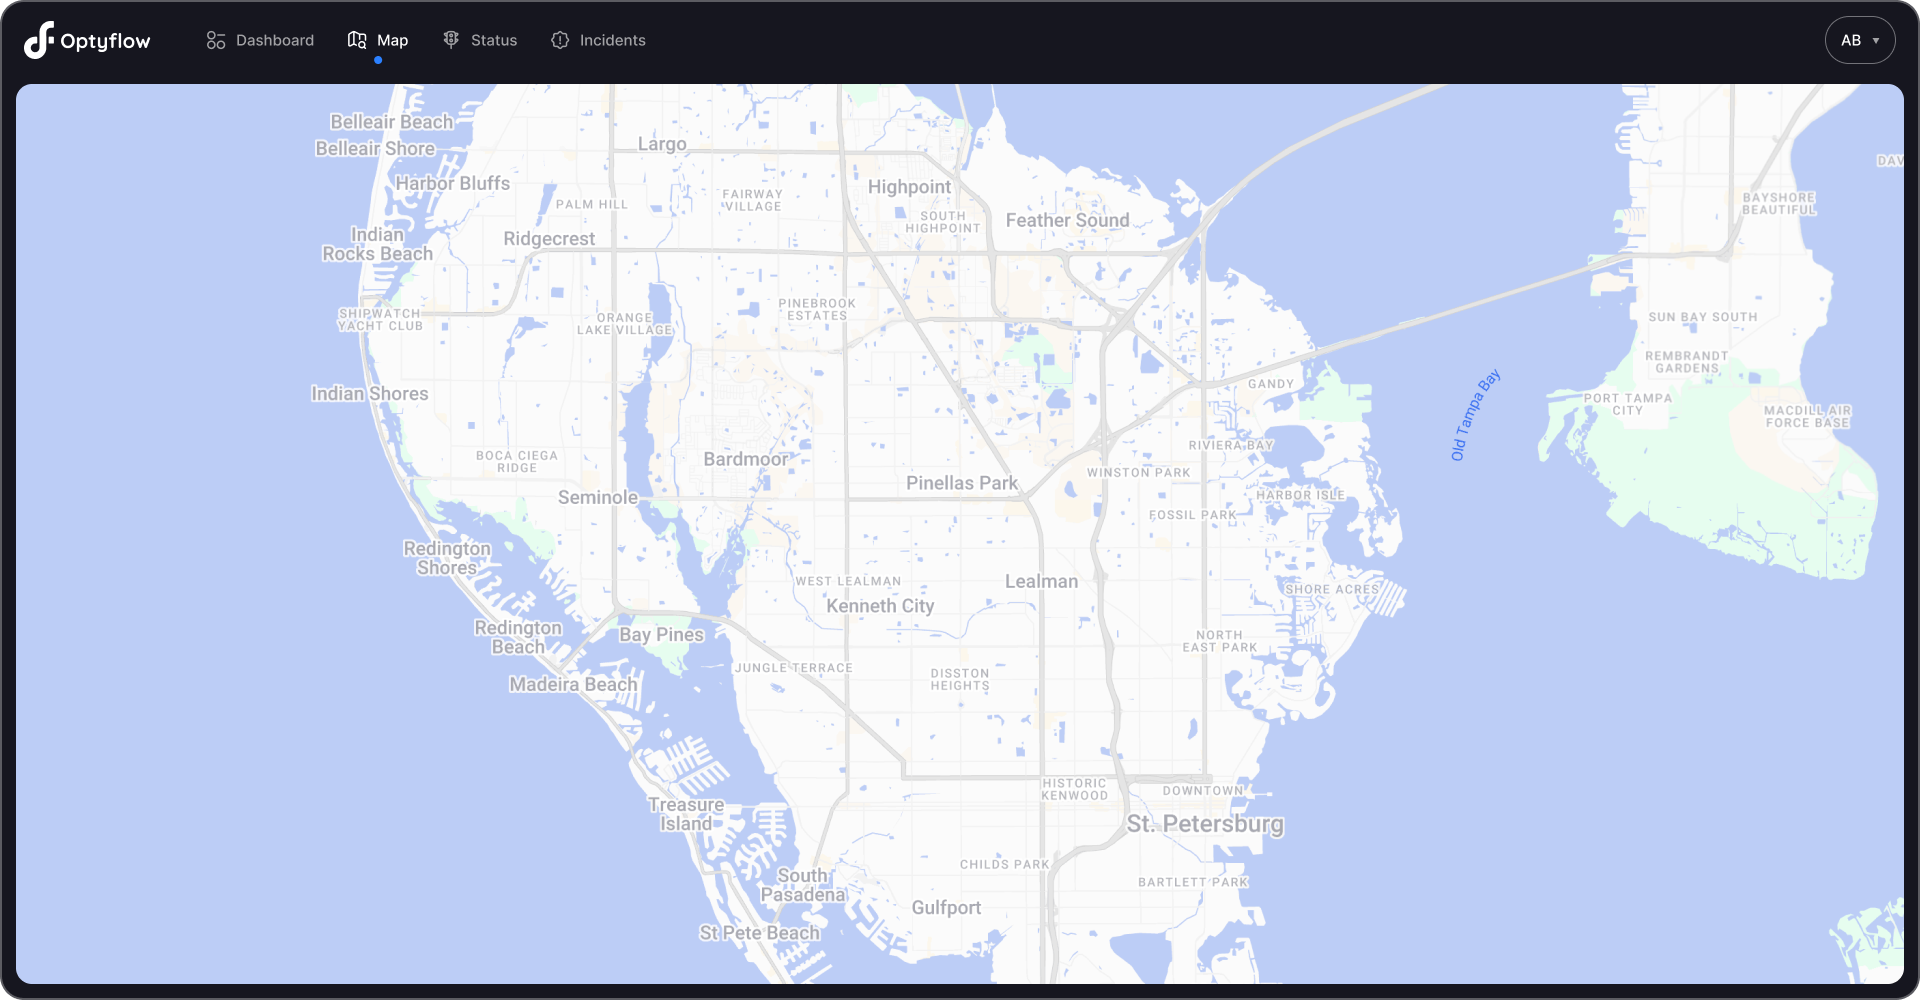
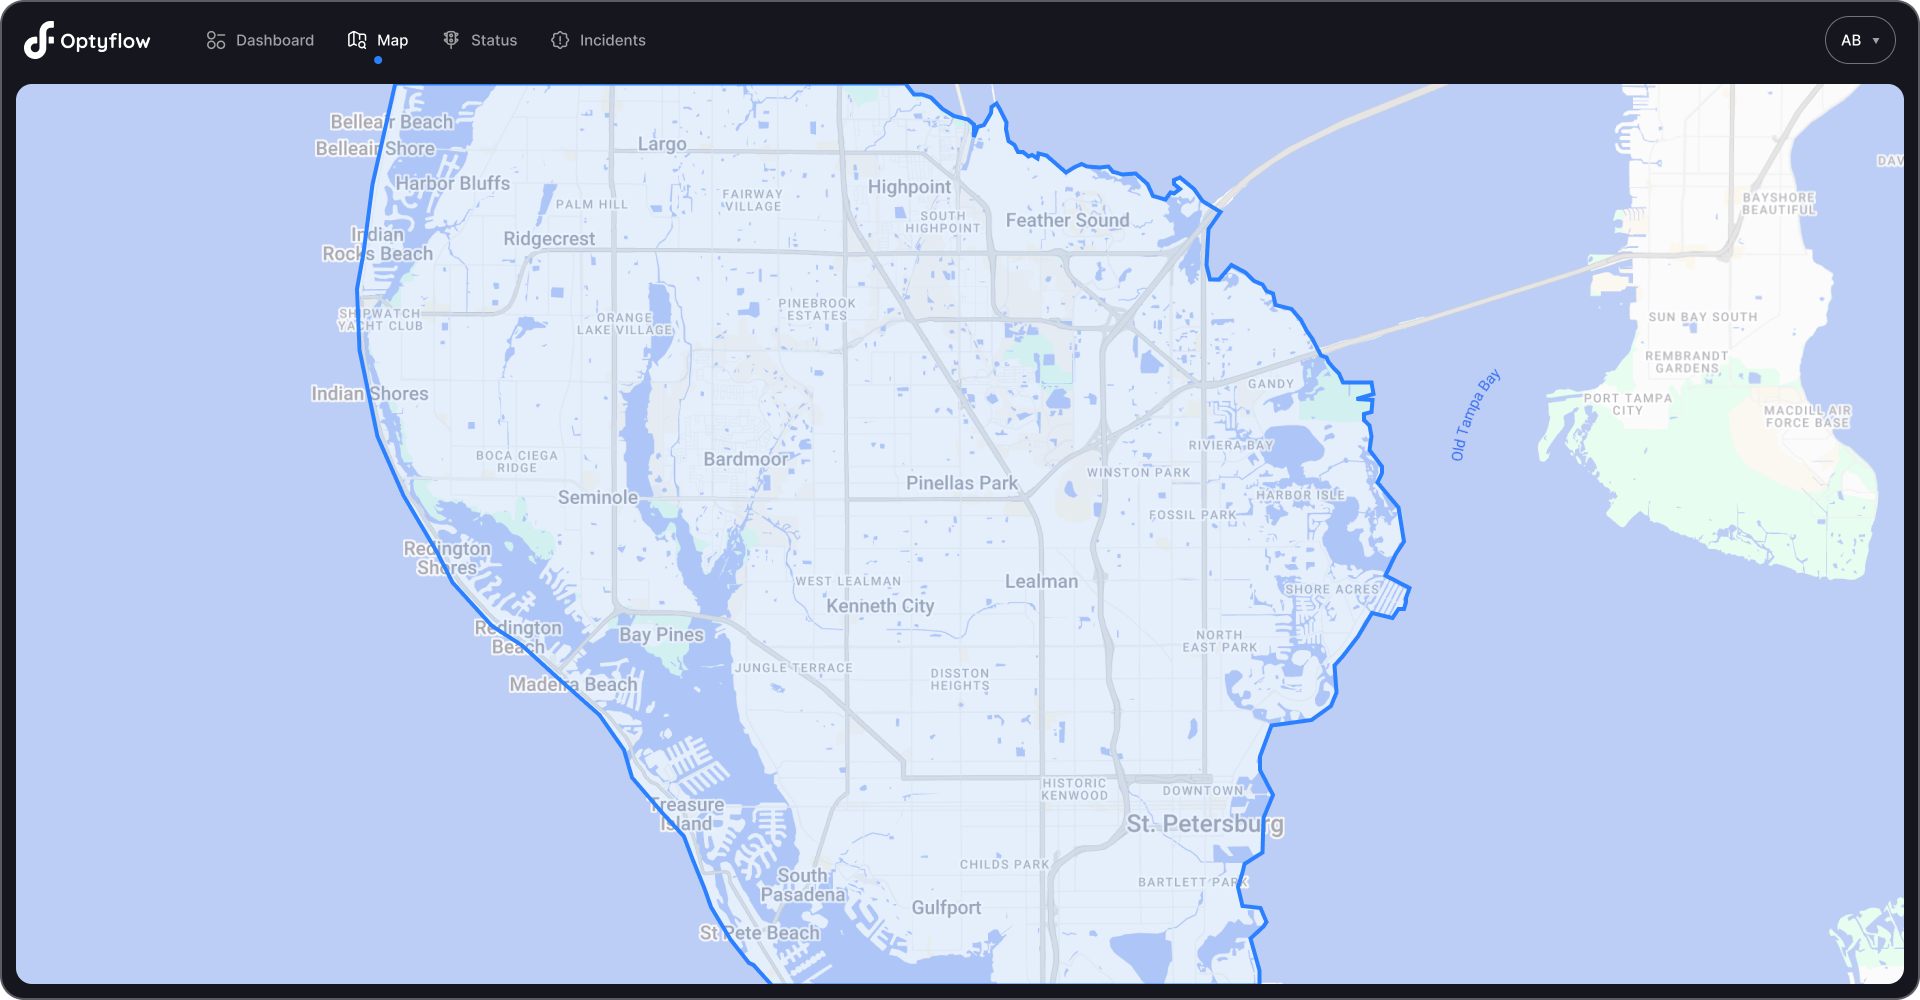
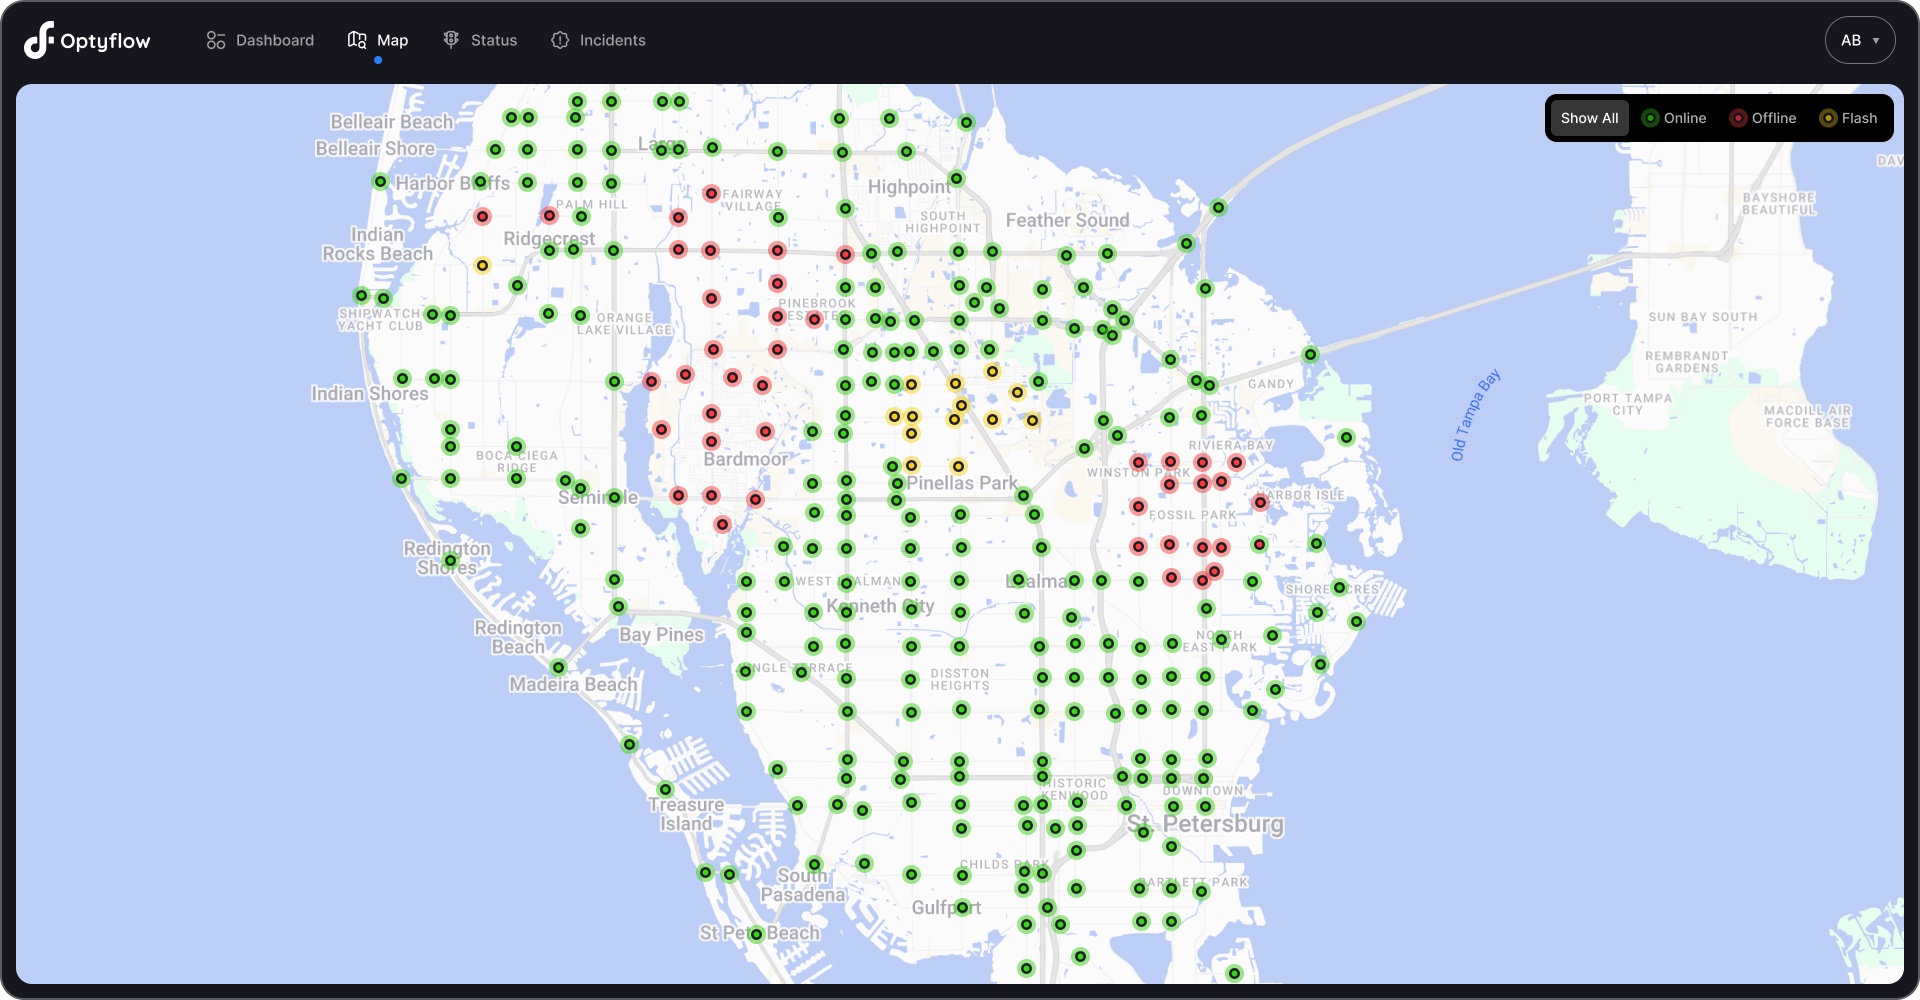
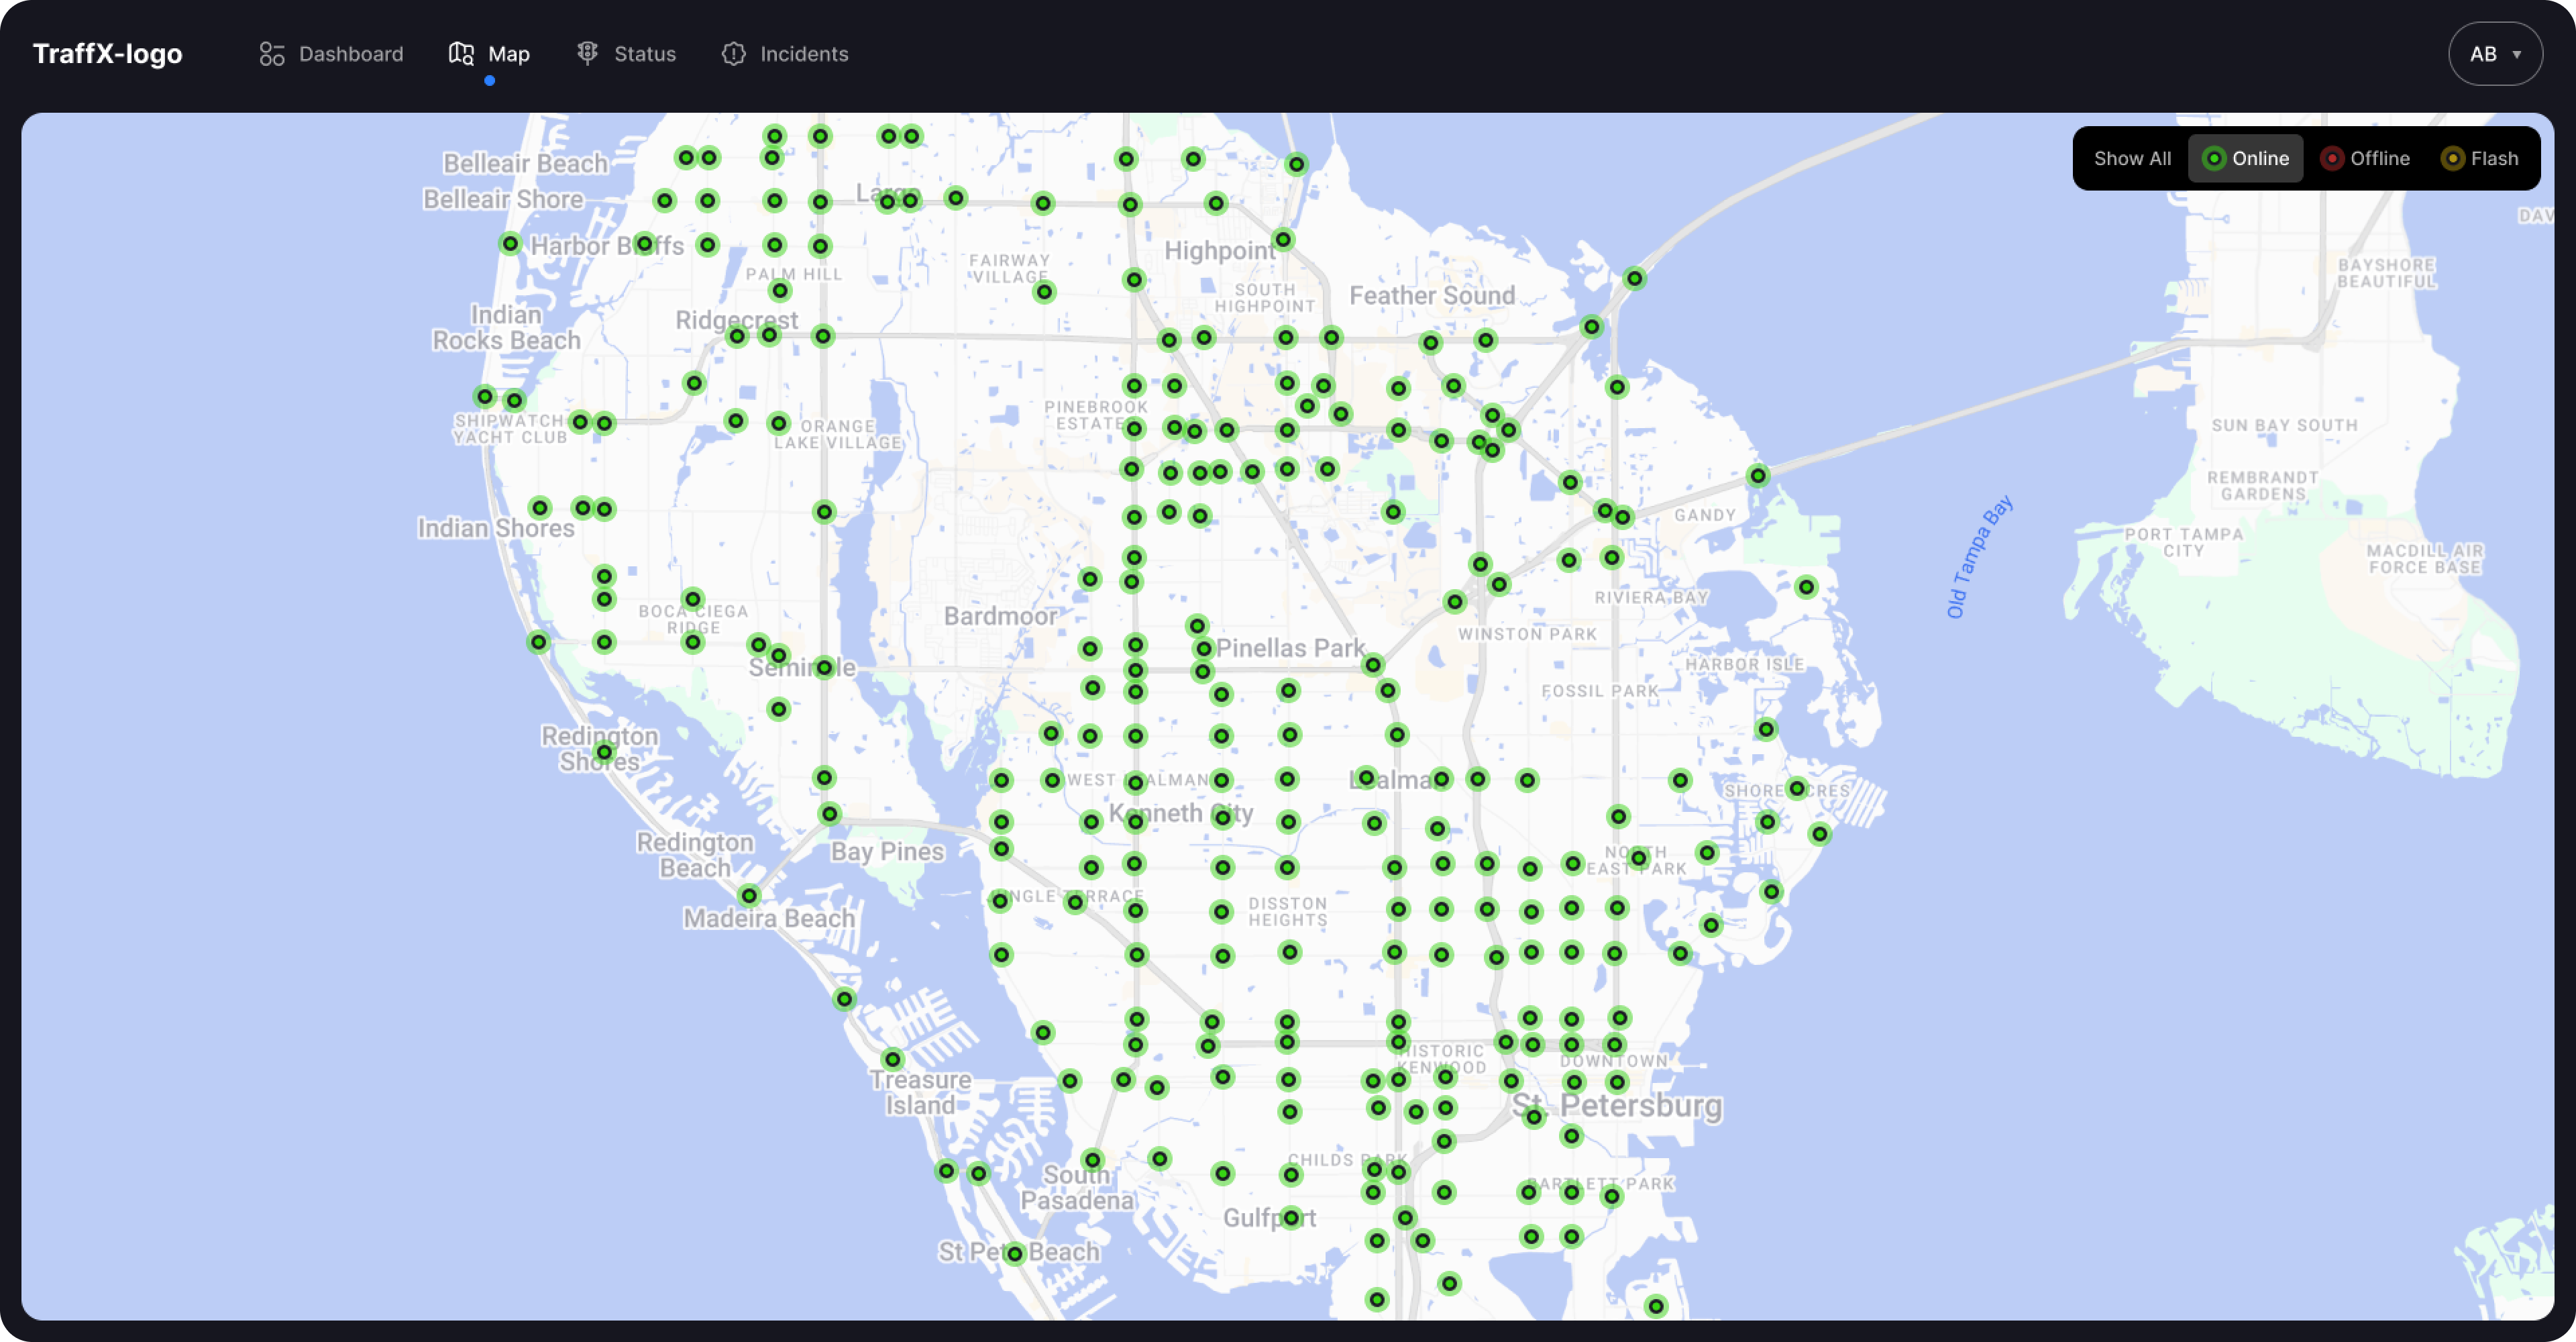
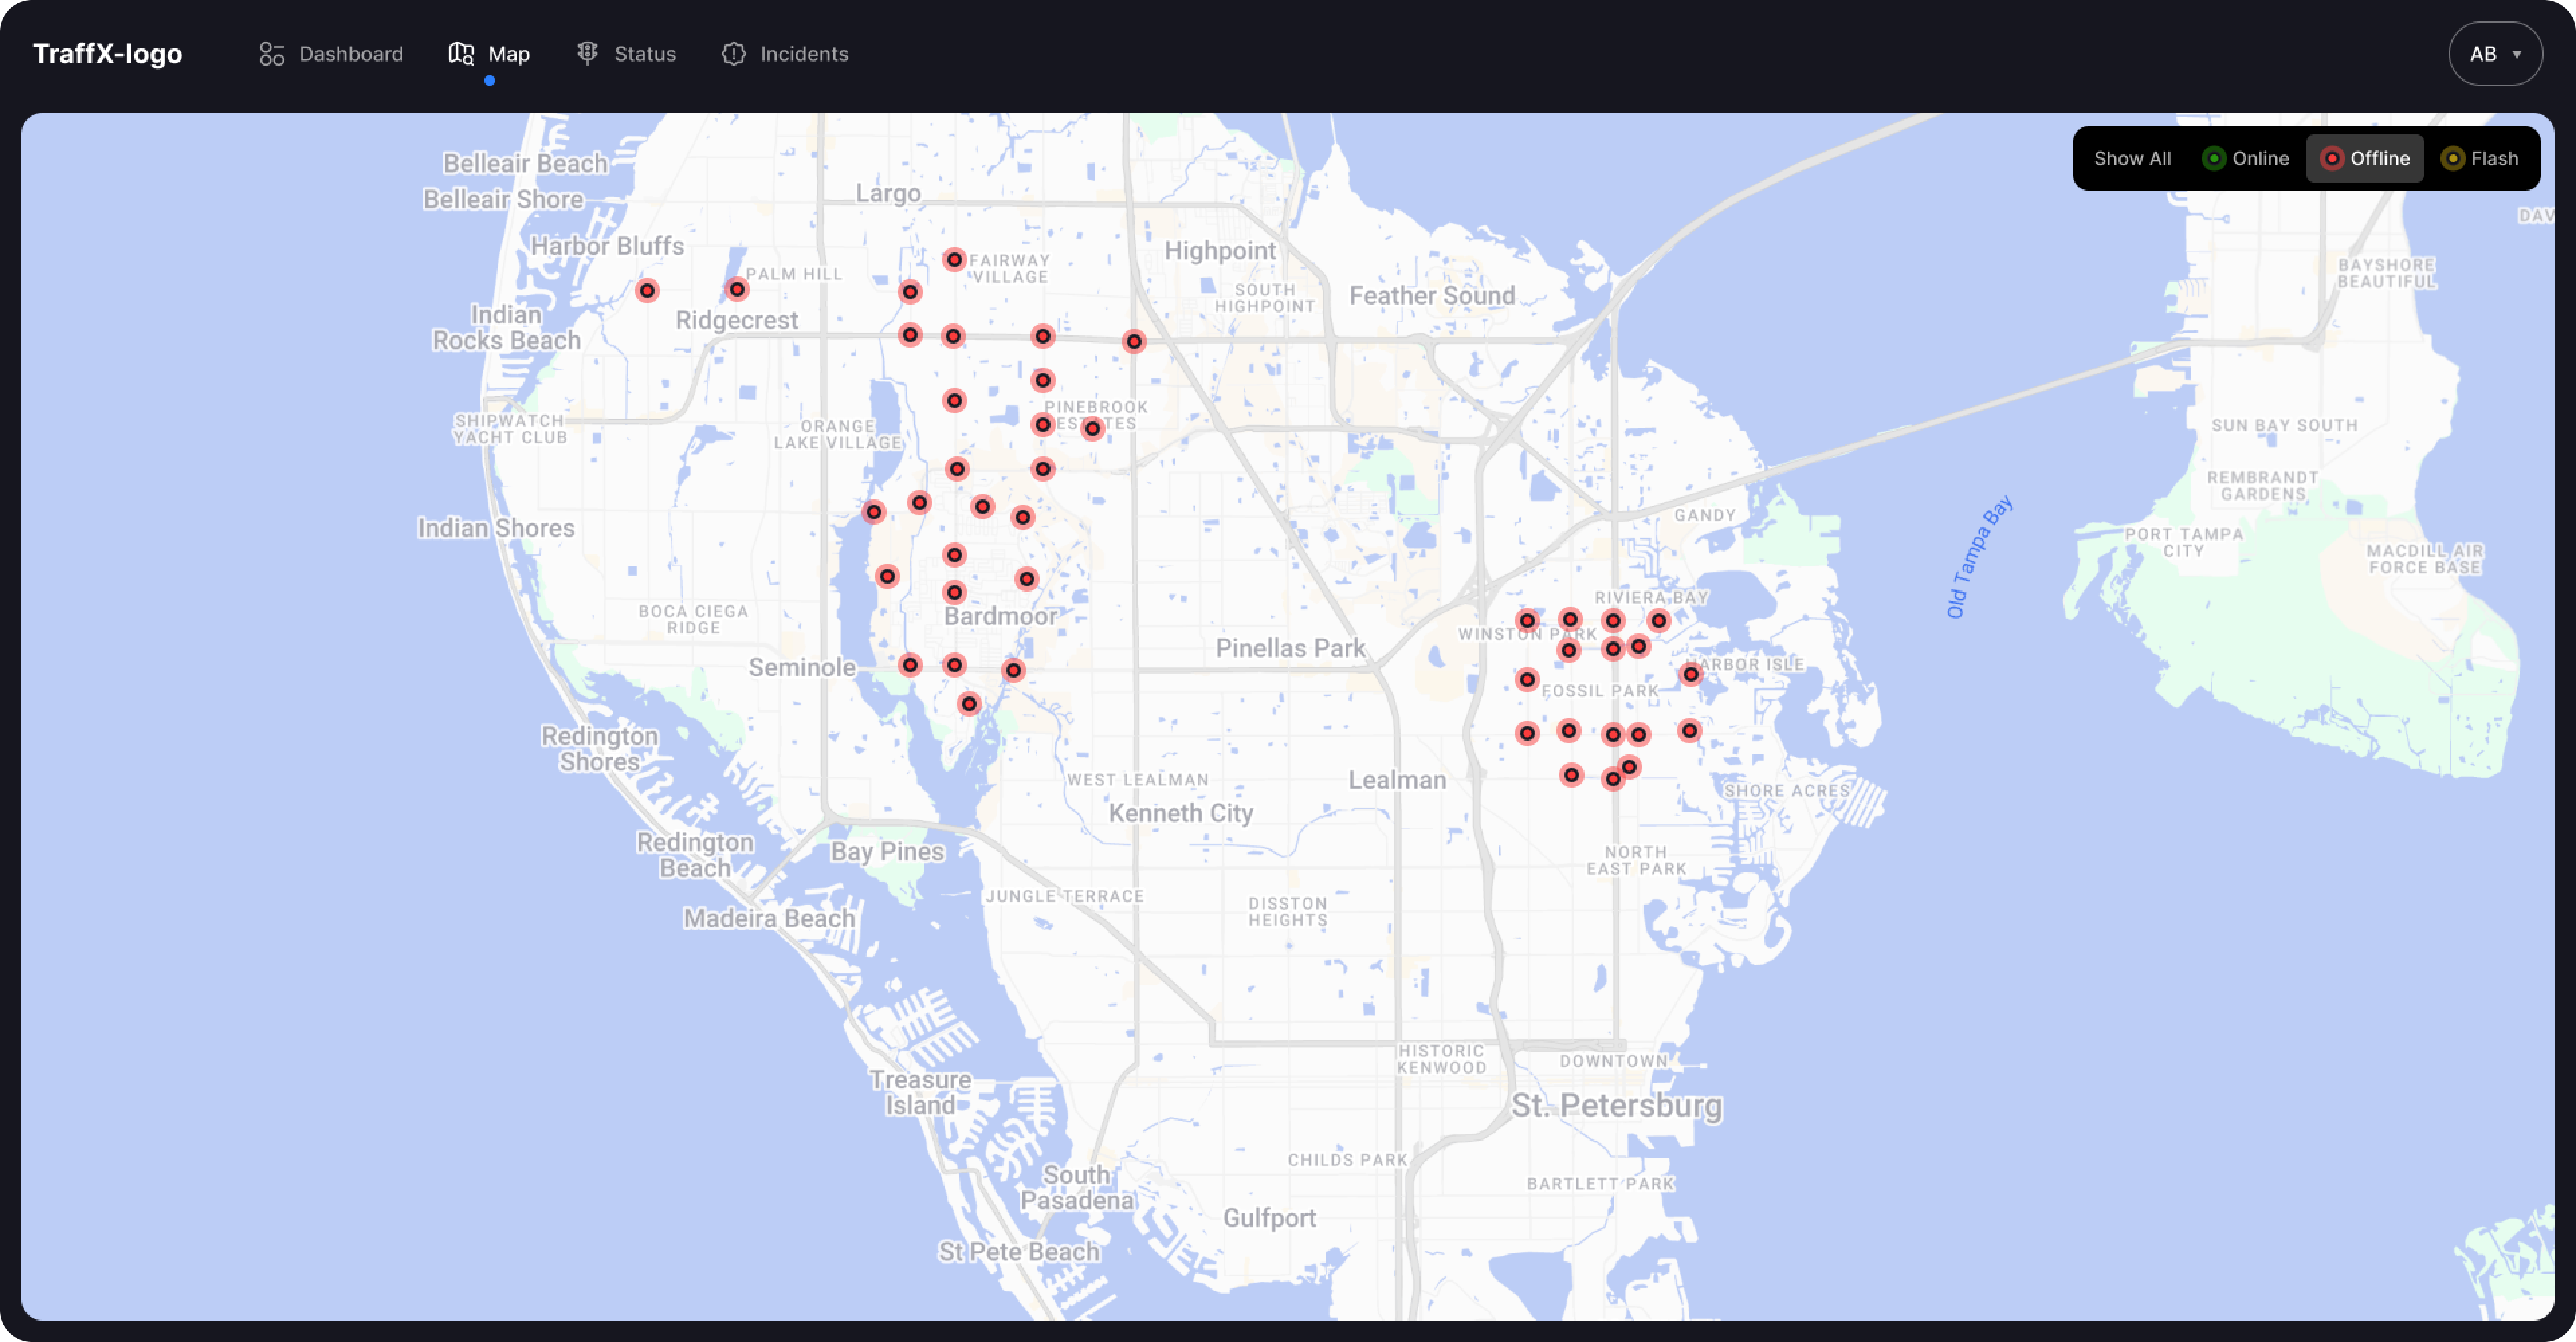
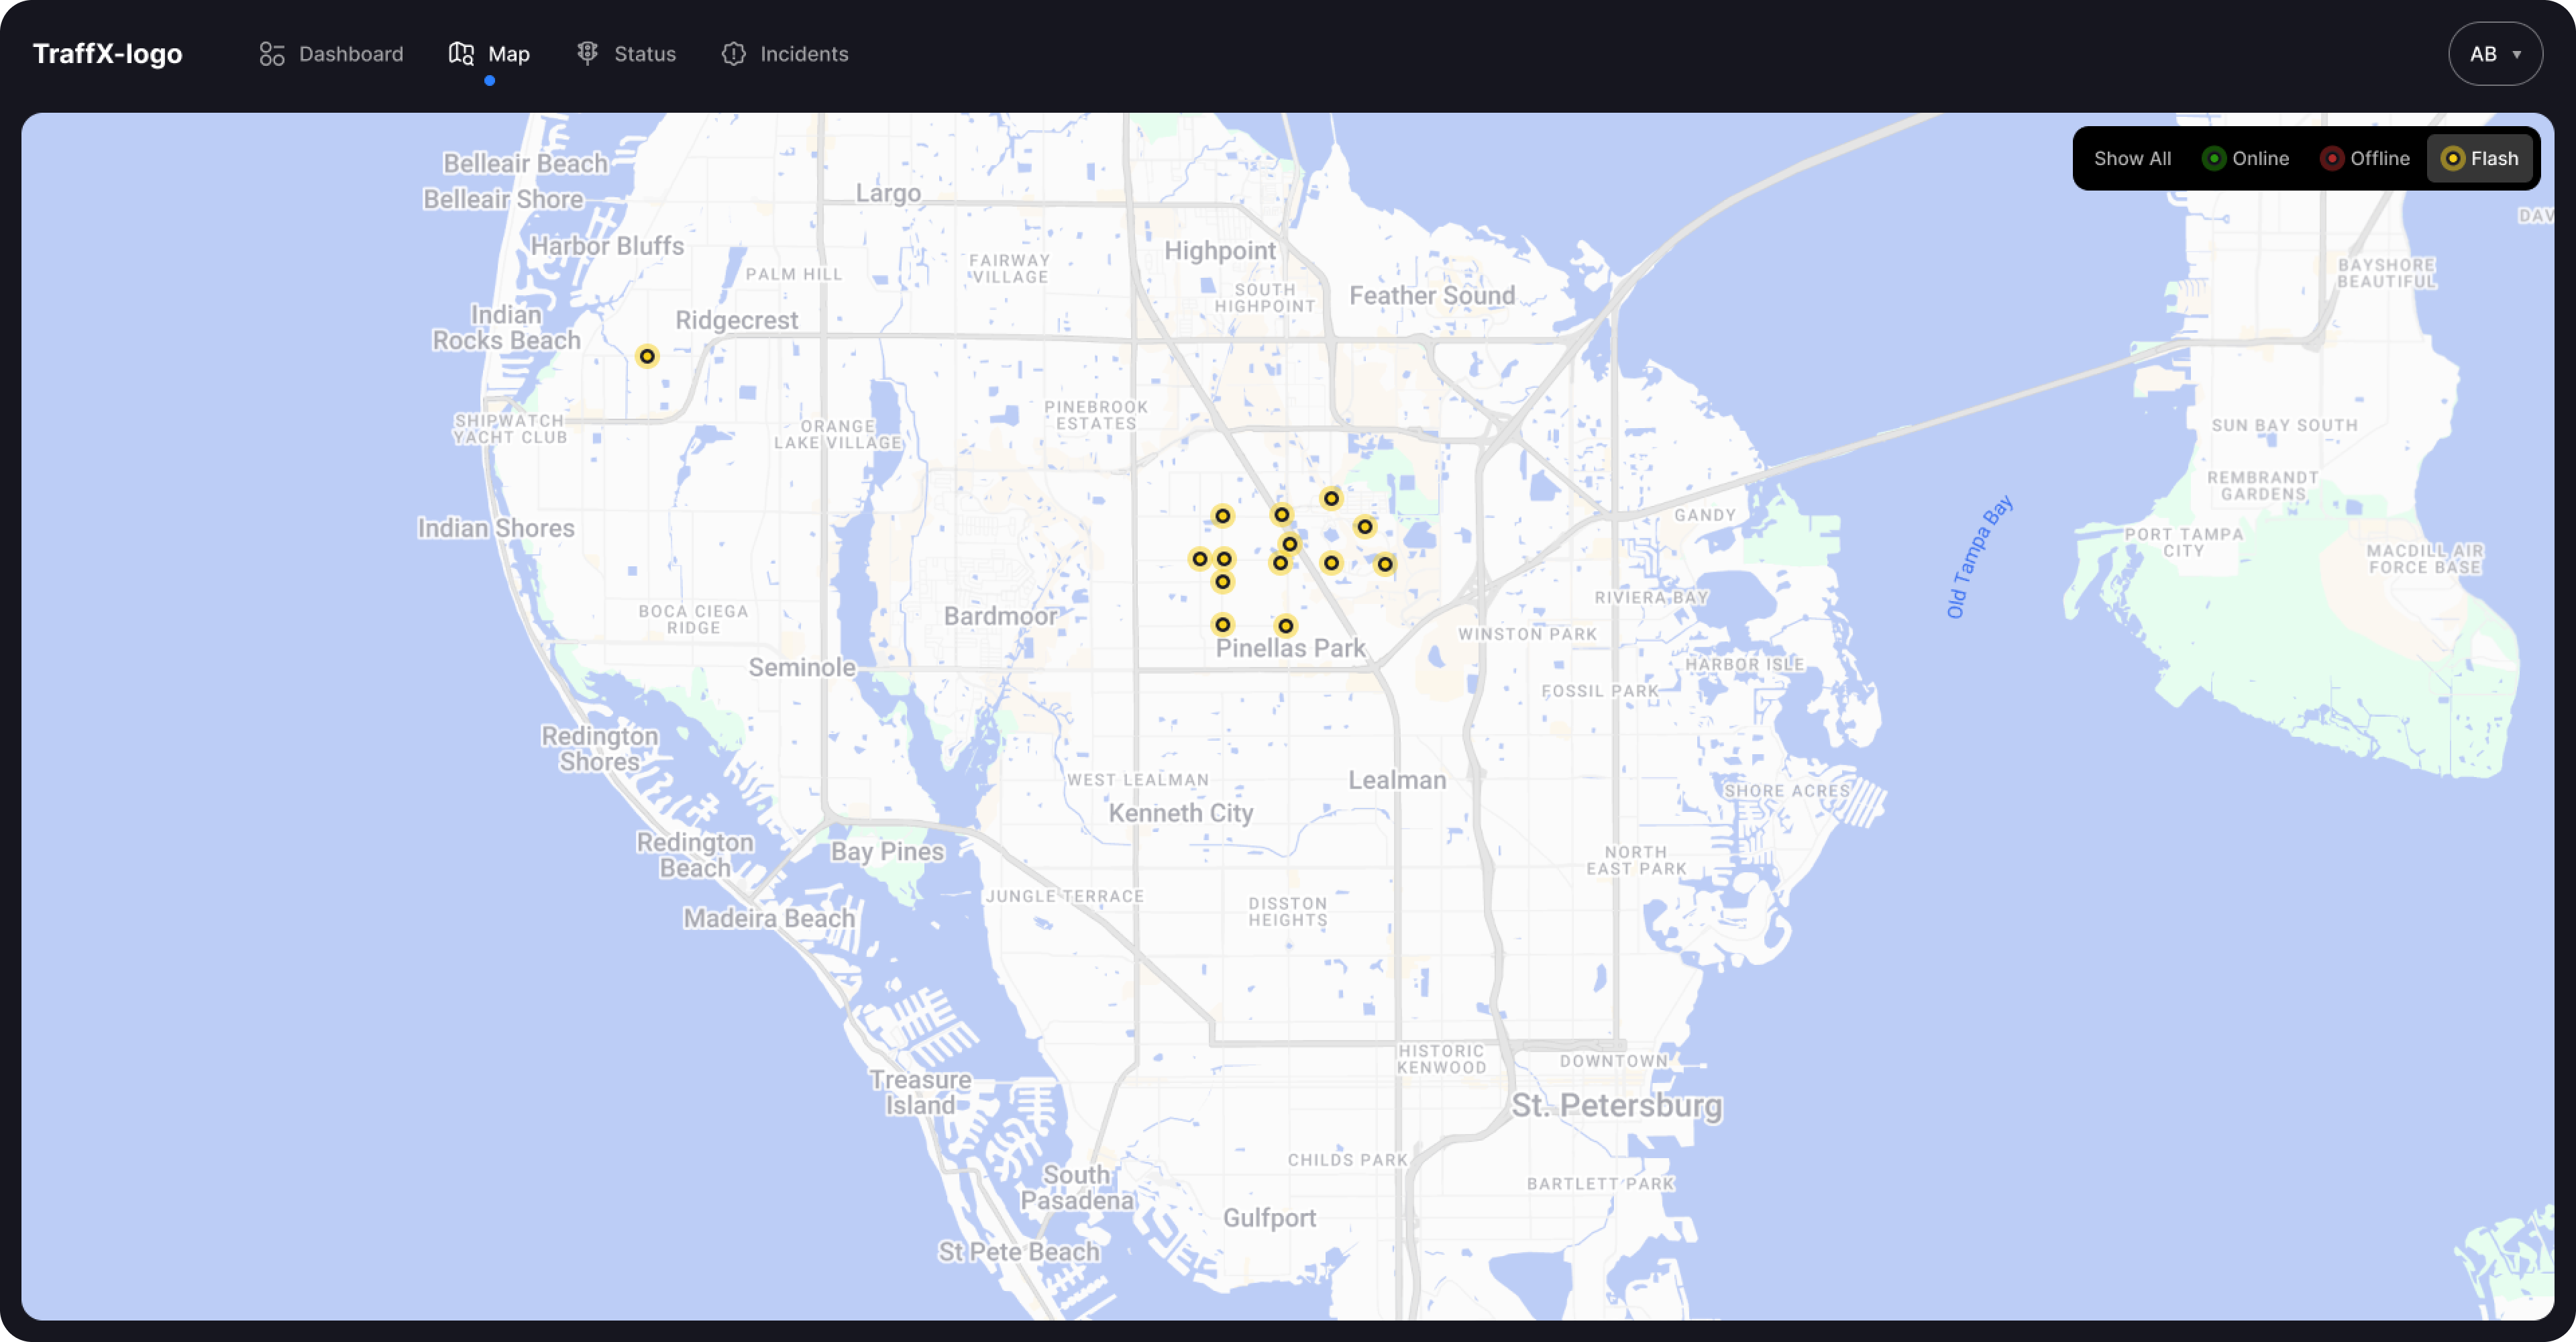
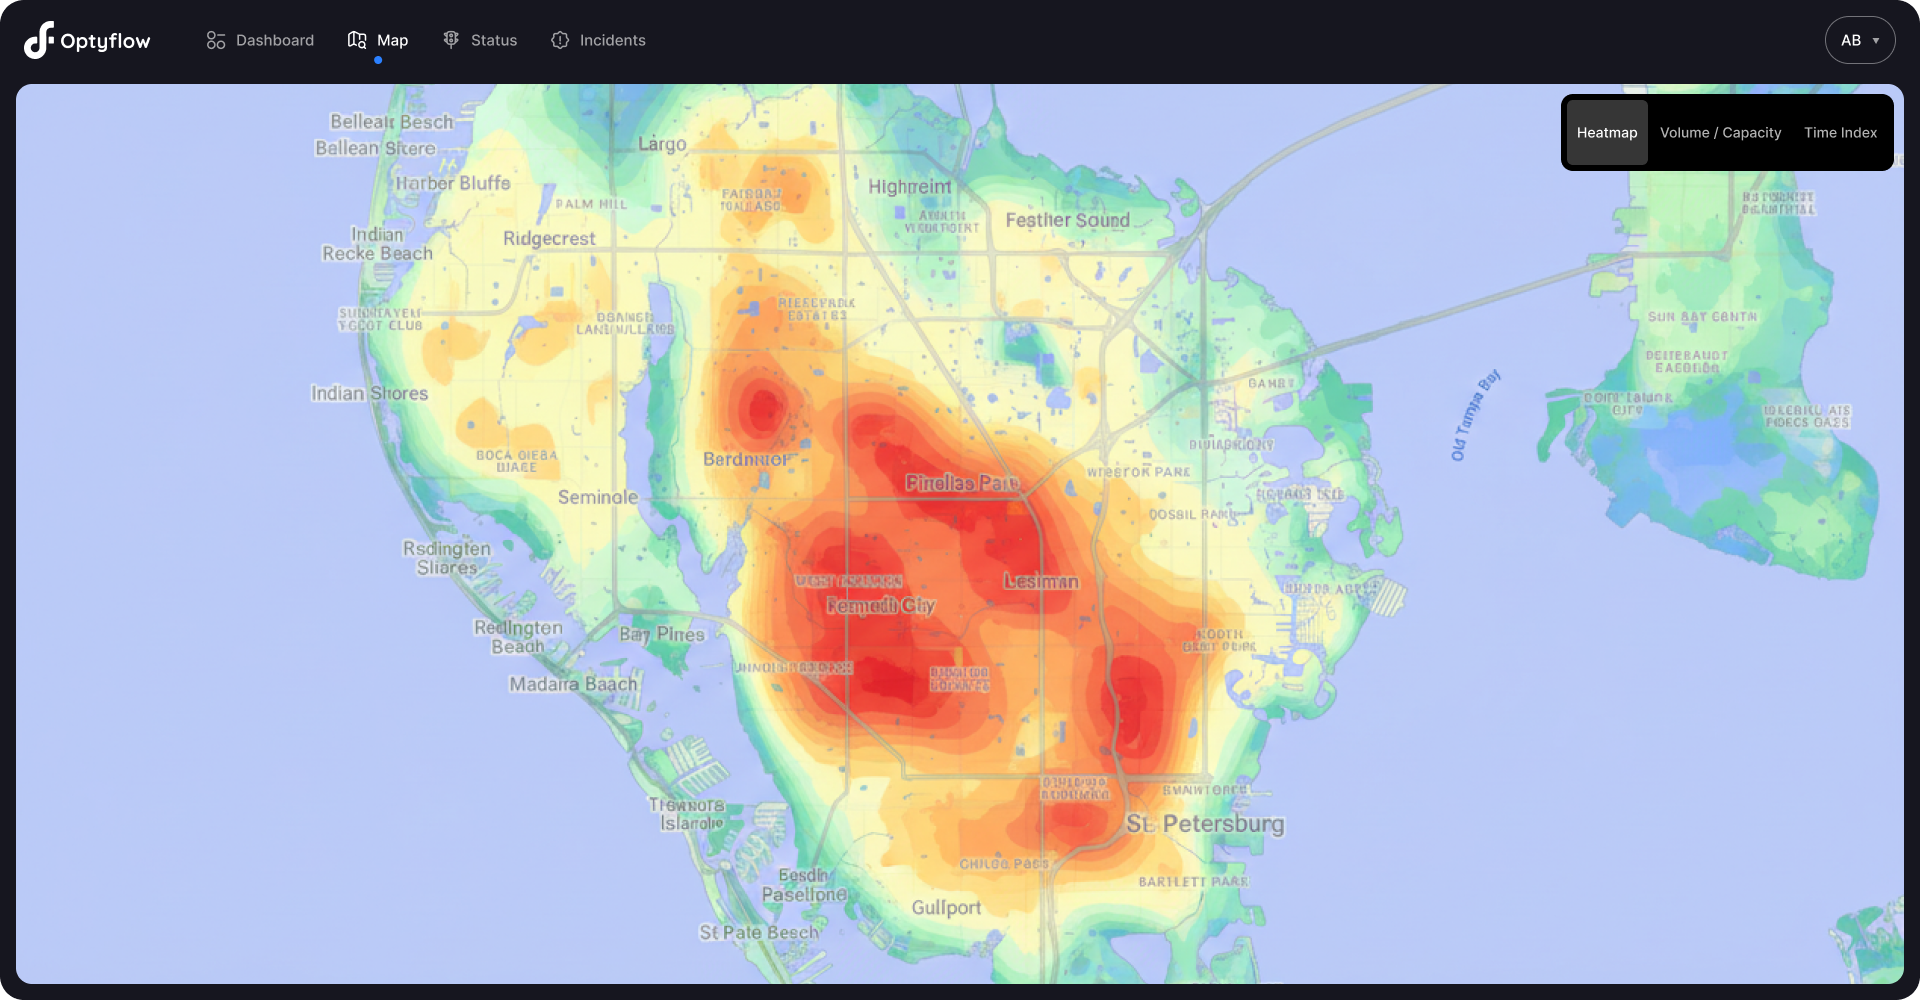
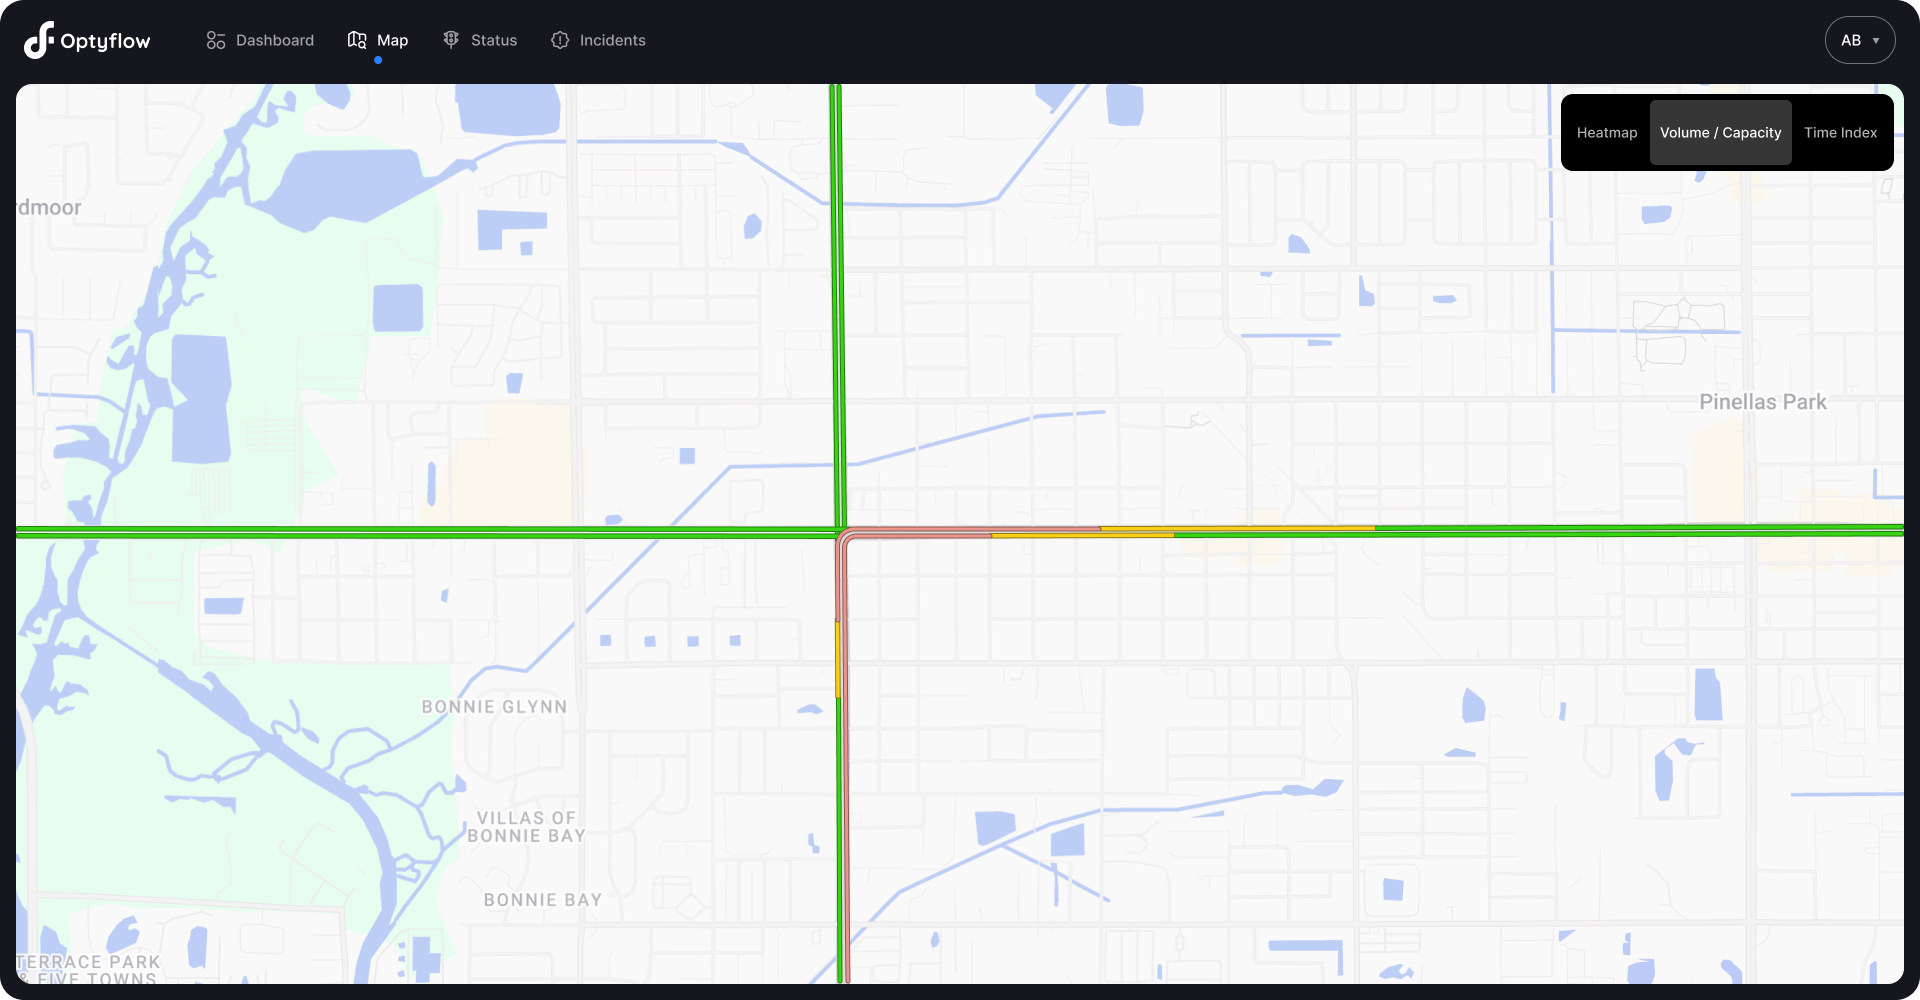
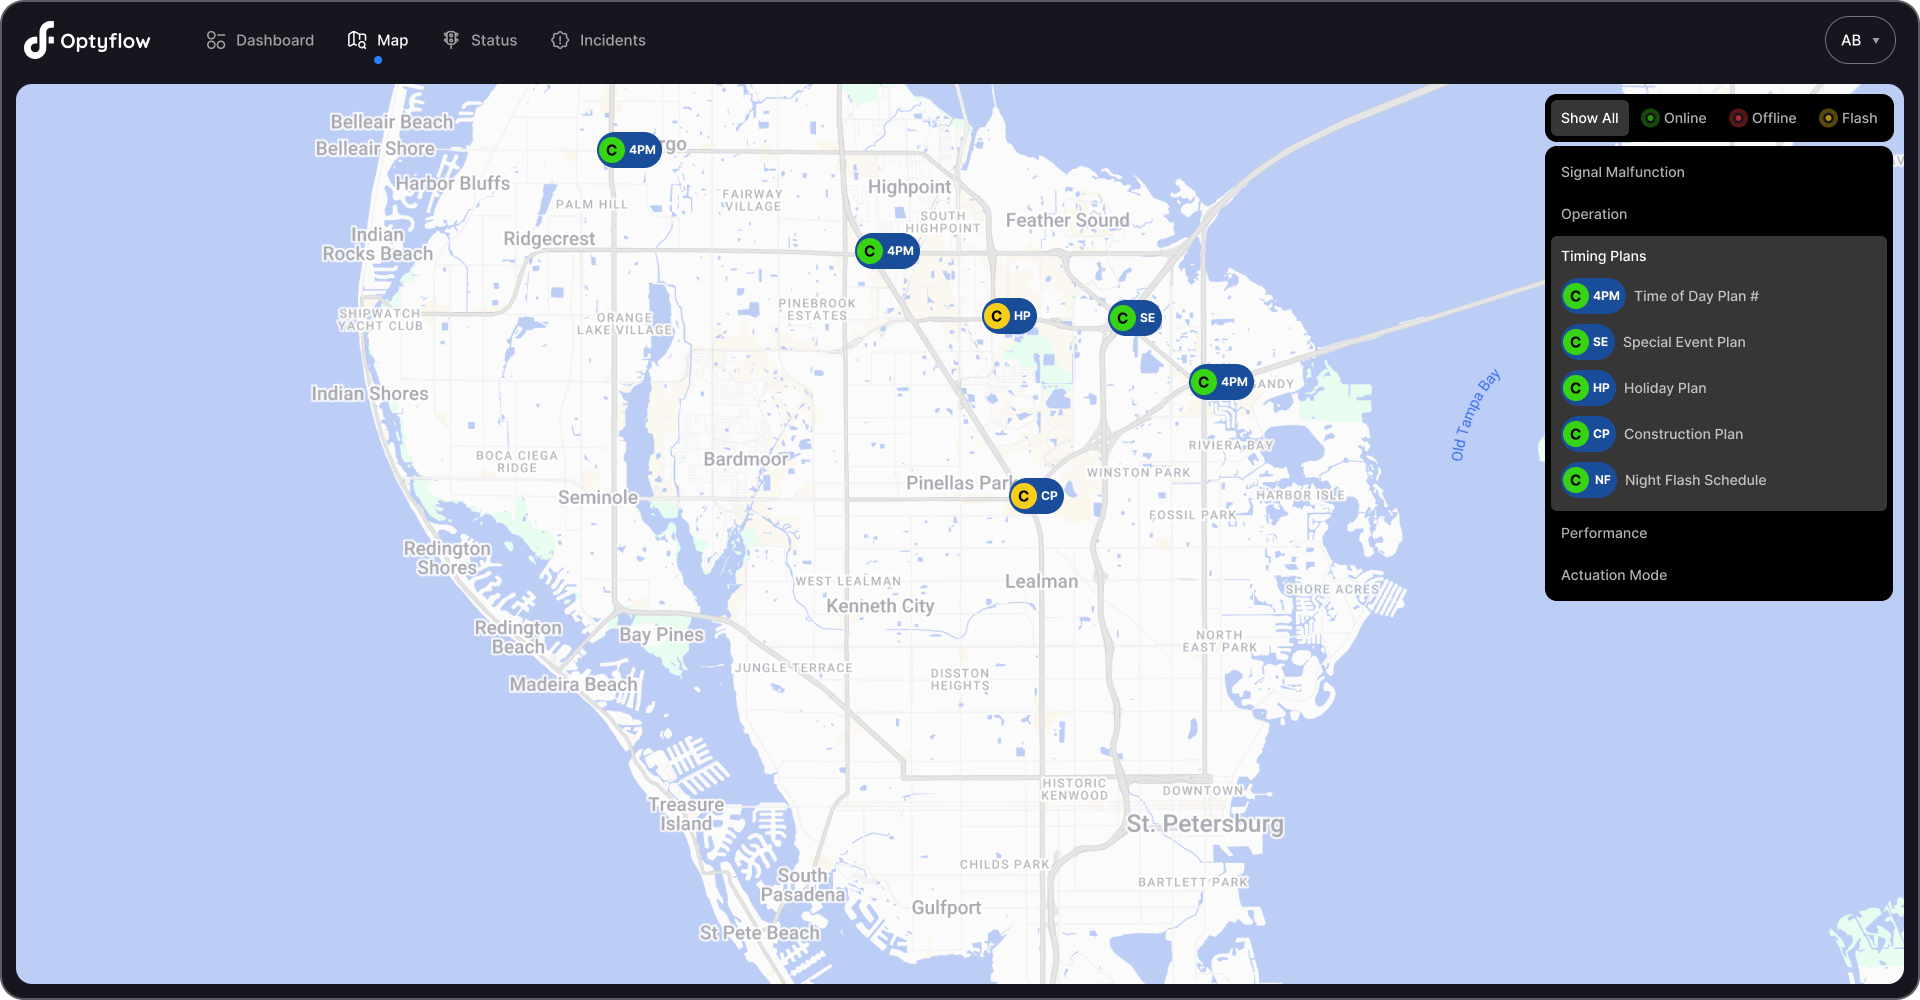
Map Layers
Project Summary
Challenge:
Insufficient operational efficiency.
Assumption:
Providing role-based traffic insights and KPI dashboards would help operators and engineers identify issues faster and make more informed decisions.
Scope of Work:
Design of a role-based traffic management dashboard, including KPI definition, information architecture, and real-time data visualization for city operators and traffic engineers.
Goal:
Improve operational efficiency by reducing the time required to analyze traffic conditions and make decisions.
Result:
Decision-making time decreased by approximately 15–20% after deployment.
Conclusion:
Customized dashboards allowed operators and engineers to access relevant KPIs and traffic insights without unnecessary data noise. Clear visualizations of traffic conditions, incidents and congestion patterns enabled faster interpretation of critical information.
Interested in seeing more?
Case Study: MaxDuel - Back Office

Favourite Books:


Favourite Songs:


All rights reserved.
Case Study 2
OptyFlow
A real-time public transportation management system built for US city operators.
Challenge:
Insufficient operational efficiency.
Assumption:
Providing role-based traffic insights and KPI dashboards would help operators and engineers identify issues faster and make more informed decisions.
Scope of Work:
Design of a role-based traffic management dashboard, including KPI definition, information architecture, and real-time data visualization for city operators and traffic engineers.
Goal:
Improve operational efficiency by reducing the time required to analyze traffic conditions and make decisions.
Key Responsibilities:
UX Research
User Interviews
Information Architecture
Ideation
Validating Ideas
Wireframing
Prototyping
Iterating
High-Fidelity Mockup
Microinteractions
Developer Handoff
Dashboard Widgets & States
Manual Advance Widget
Initial state if the ‘Manual Advance’ is disabled in the main settings. Can be enabled via the link.
Widget when ‘Manual Advance’ is enabled in the main settings. ‘Enter Manual Mode’ turns it on. The flow prevents accidental errors.
When the widget is ‘ON’ it allows operators ‘advance’ to another ring or exit manual mode by clicking on respective buttons.
Exploring & Validating Options


Interactive Prototype - Testing
Map Layers
Project Summary
Challenge:
Insufficient operational efficiency.
Assumption:
Providing role-based traffic insights and KPI dashboards would help operators and engineers identify issues faster and make more informed decisions.
Scope of Work:
Design of a role-based traffic management dashboard, including KPI definition, information architecture, and real-time data visualization for city operators and traffic engineers.
Goal:
Improve operational efficiency by reducing the time required to analyze traffic conditions and make decisions.
Result:
Decision-making time decreased by approximately 15–20% after deployment.
Conclusion:
Customized dashboards allowed operators and engineers to access relevant KPIs and traffic insights without unnecessary data noise. Clear visualizations of traffic conditions, incidents and congestion patterns enabled faster interpretation of critical information.
Interested in seeing more?
Case Study: MaxDuel - Back Office
Favourite Books:
Favourite Songs:
All rights reserved.